Energy Efficiency Scoreboard
Without energy efficiency progress achieved since 2010, EU industry energy final consumption would have been 30% higher than its current level in 2023. Industrial electrification has been slow since 2010, and is even decreasing in half of EU countries, according to the 2025 edition of the Odyssée-Mure European Energy Efficiency Scoreboard.
The reduction in EU industrial energy use since 2021 was mainly driven by energy savings and structural shifts, supported by high energy prices, according to the Odyssée-Mure brief, presented in January 2026. Industrial CO₂ emissions fell by 23% between 2010–2023.
EU industrial electrification has been slow since 2010 and the share of electricity in energy consumption has increased by just 0.5 points since 2010, amounting to 33% in 2024.
The average energy price in industry varied significantly over the past years, souring by 16% in 2021 and 54% in 2022, and then decreased by 10%/year from 2022 to 2024. The price remained however 33% higher in 2024 than in 2019, according to the brief.
Decline of energy use
EU industrial final energy consumption decreased sharply etween 2021 and 2023 (-12%), primarily due to soaring energy prices. The total industrial energy use dropped by 29 Mtoe, mainly due to:
- Energy savings (2/3 of the reduction)
- Structural changes toward less energy-intensive production (1/3)
- High energy price
Early estimates for 2024 suggest a modest increase, but with consumption remaining 11% lower than in 2010.
Poland experienced the largest decrease in consumption since 2021 among large EU countries. Germany is the largest contributing country to the EU consumption reduction followed by France, Italy and Spain.
Energy efficiency trends
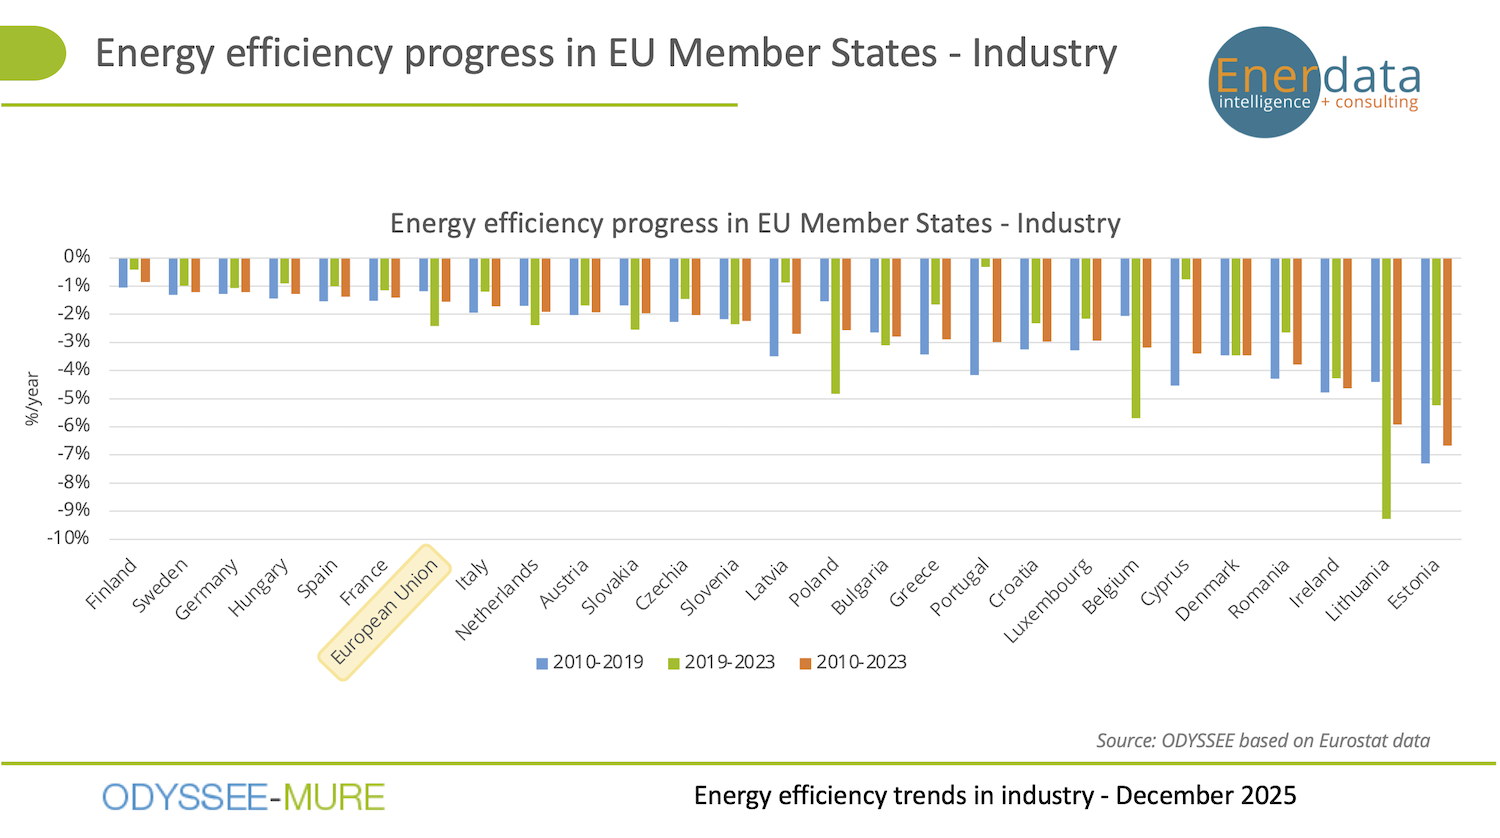
Energy efficiency improvement accelerated from 2019 to 2023 (2.4%/year) compared to the 2010-2019 period (1.2%/year). However, 2024 estimates suggest a return to pre-2019 trends, according to the Scoreboard.
Since 2000, final energy savings reached 100 Mtoe in 2024 (of which, almost 60 Mtoe since 2010). Without energy efficiency progress, EU industry final energy consumption would have been 100 Mtoe higher than its current level (i.e. 30% higher).
Several factors may explain the acceleration of energy savings since 2020:
- Better management of energy use and emergency measures to combat the huge prices increases, particularly in 2022.
- Investment in energy saving equipment and technologies (growth driven in 2021 and price driven in 2021-22).
- In some branches, part of the “measured savings” corresponds to structural effects within industrial branches (“product effects”). This was especially significant in chemicals with a high growth for pharmaceutical products and a deep recession for basic chemicals.
Sector Trends
The Odyssé-Mure brief lists five branches that account for around 70% of the industrial energy consumption in the EU; chemicals (20%), non-metallic minerals (14%), paper (14%) food (13%) and steel (10%).
- Chemicals contributed most to the recent decline and led efficiency gains.
- Steel efficiency showed almost no overall improvement since 2010.
- Cement efficiency improved steadily across most countries.
The overall results at the EU level should be interpreted with caution, since significant differences are observed among countries, and among industrial branches and indicators may include changes in energy consumption due to structural effects within a branch.
Odyssée-Mure policy brief